The Most Important Mobile Attribution Statistics and Trends for 2024

Mobile attribution is the process of measuring how effective mobile marketing campaigns are across different channels and platforms. In 2024, with over 5 billion smartphone users worldwide and the majority of web traffic coming from mobile devices, understanding mobile attribution statistics is vital for marketers aiming to optimize their budgets, track user journeys, and boost their mobile marketing performance.
For any business that wants to succeed in the mobile-first world where consumers spend more time on their smartphones than on any other device, accurate mobile attribution is crucial. According to Statista, there are currently over 5 billion smartphone users worldwide, and this number is expected to reach 6.1 billion by 2028. Moreover, the average person spends 3 hours and 15 minutes on their phones.
Smartphones are a huge part of our lives, so it’s important for marketers to understand how they are used. The following article provides data on the most interesting mobile attribution statistics that should help marketers plan and run their marketing campaigns in the most optimal way.
What Are the Key Mobile Attribution Statistics in 2024?
Below, we share some of the most important mobile attribution statistics in 2024.
These will help you understand the current state and future trends of mobile marketing and attribution.
We cover global and US markets, as well as different aspects of mobile attribution, such as:
- platforms,
- channels,
- metrics,
- challenges, and
- best practices.
How Big Is the Global Mobile Advertising Market?
The mobile ad industry is booming, as more advertisers are shifting their budgets from traditional media to digital media, especially mobile. According to eMarketer, global mobile ad spending reached $327 billion in 2022 and is projected to grow to $400 billion in 2024.
The US is the largest mobile ad market in the world. The mobile advertising spend in 2022 reached $170 billion and is estimated to reach $235 billion by 2025.
China is the second-largest market with $125 billion, followed by Japan.
It is worth noting that the growth of mobile ad spend is expected to slow down.
Overall, mobile ads make up a bigger portion of the total spend on digital advertising, and this share is expected to reach 68% by 2027. This coincides with smartphones being the main way of accessing the Internet; in 2022, almost 60% of web traffic was coming from mobile devices.
What Are the Usage Patterns and Leading Mobile Apps in 2024?
Data shows that 90% of the time spent on a mobile device is spent within apps, with the remaining part being spent in mobile browsers.
The most popular app globally is TikTok. It is also the most popular app in the US and UK; while Instagram is at the top in India and WeChat in China. It is worth noting that all these apps are ‘walled gardens’ – online sandboxes that are separated from the rest of the Internet. For many users, such apps represent their whole Internet experience – something to have in mind when planning an advertising strategy.

How Do Advertising Costs on Mobile Compare to Desktop in 2024?
It is difficult to compare costs and prices between desktop and mobile since both device types appeal to slightly different users and are leveraged differently by marketers.
The average CPM on mobile devices is reported to be around $2 on Android and $5 on iOS. This range is in stark contrast to the wide range of $3.5 to $15 on desktop.
It’s important to note that the overall costs of advertising are shaped by a variety of factors, not just device type. A marketer’s goals may differ. Or advertising budgets and the number of given device types in an outlined audience.
It is reported that conversion rates are lower on mobile devices, which could explain lower prices for CPM. However, considering the scale of proliferation of mobile devices, a marketer can leverage scale and generate more income on mobile just because there are more mobile users.
This also doesn’t tell the whole story. Most users research a product on their smartphone while being in store. Seeing a brand name in a mobile ad while in store may push a user toward this brand, so even if the ad didn’t result in an immediate conversion, it doesn’t mean it didn’t work.
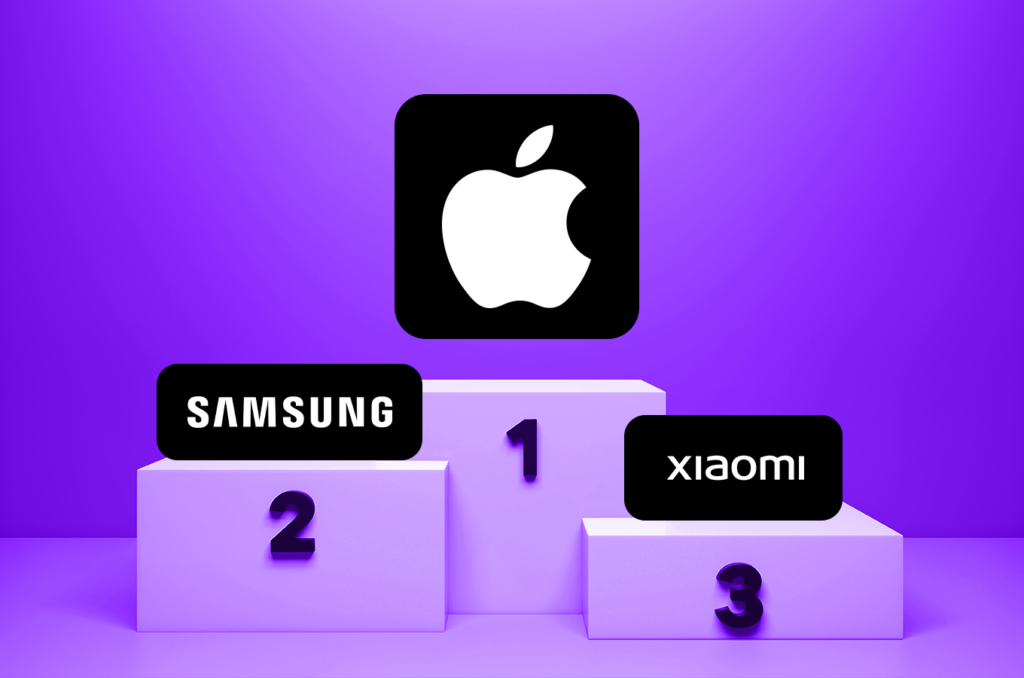
What Are the Most Popular Smartphone Brands for Mobile Advertising?
The most recent data shows that Apple has the biggest piece of the mobile pie, with 3 out of 10 smartphones being iPhones. A close second (and often trading the first place with Apple) is Samsung, with Xiaomi in third place.
While it is tempting to target iPhone users only, as they are stereotypically more willing to spend money and have the numerical advantage, a problem may arise from Apple’s approach to privacy and data tracking. In short, iPhone users may choose to opt out from tracking, which may leave you with less accurate data or broken attribution.
The Voluum ad tracker, when paired with a mobile measurement partner such as AppsFlyer, may accept conversions without click-identifying data and attribute them to the whole campaign instead of a concrete visit. This gives marketers the best fighting chance to still make decent profits even with restrictions put by Apple.
How Is Mobile Attribution Tracked and What Are the Best Practices?
The mobile world requires a slightly different approach to tracking and measurement than the more traditional desktop world. To track in-app events, you need to implement a special piece of software called an SDK, supplied by your mobile measurement partner or mobile attribution software. This SDK will report app installs and in-app activities, such as achieving a certain milestone in a game.
However, most advertisers don’t focus solely on mobile devices. Even app developers advertise them on desktop. The best approach is a mixed one, with multiple channels used to reach audiences on various stages of a conversion funnel.
The best way to handle this is to have an ad tracker such as Voluum that can connect all data from multiple channels and sources, including in-app data, and enable in-depth analysis of gathered data.
Once you connect all data to Voluum, you will know:
- Which channels or sources are driving the most installs, conversions, or revenue for my mobile app or website?
- How are users interacting with my app or website after installing or visiting it?
- Which campaigns or creatives are generating the highest engagement, retention, or loyalty among my users?
- How can I optimize my budget allocation and bid strategy across different channels or platforms?
Try Voluum and start advertising on mobile or desktop devices now!
Frequently Asked Questions
Question: What is mobile attribution and why does it matter for marketers in 2024?
Mobile attribution tracks how users discover, engage, and convert on mobile apps or web, helping marketers understand which channels and campaigns are most effective at driving installs, sales, or other key actions.
Question: How much will global mobile ad spending reach in 2024?
Global mobile ad spending is projected to reach $400 billion in 2024, with the U.S. as the largest market, followed by China and Japan.
Question: How do mobile CPMs compare to desktop CPMs in 2024?
Mobile CPMs average about $2 on Android and $5 on iOS, while desktop CPMs can range from $3.5 to $15, driven by different user behaviors and market factors.
Question: What are the challenges of mobile attribution on iOS devices?
Due to Apple’s privacy rules, iPhone users can opt out of tracking, which may leave marketers with less granular attribution data. Using solutions like Voluum with a mobile measurement partner helps maintain campaign-level insights.
Question: Why do marketers need advanced tracking solutions like Voluum?
Because Voluum connects and analyzes data from all paid and organic channels—including in-app events—marketers gain a unified view of their campaigns, can optimize budget allocation, and improve mobile marketing ROI.


