
Voluum’s Scheduled Reports feature allows you to automatically export your campaign data to CSV files, enabling integration with leading data visualization and analytics platforms like Looker Studio, Tableau, and Power BI. With Scheduled Reports, you can create custom dashboards, analyze key performance metrics, and share insights with your team or clients for more informed decision-making.
✅ Create custom dashboards with the most important parts of your data
✅ Share and present vital metrics with external parties with ease
✅ Employ advanced data analysis tools to gain a competitive advantage
Interested? Keep reading, we lay down the benefits and setup below.
What Are Scheduled Reports in Voluum and How Do They Function?
Scheduled Reports are a part of a new section we call Advanced Reports. As the name suggests, it takes the normal reporting you already know to the next level.
Scheduled reports allow you to outline a scope of data and generate an email with a downloadable CSV file that will be sent to email addresses provided. People can save this link, as it will not change.
What will change is the file under this link: each day, at a set time, it will be updated with new data.
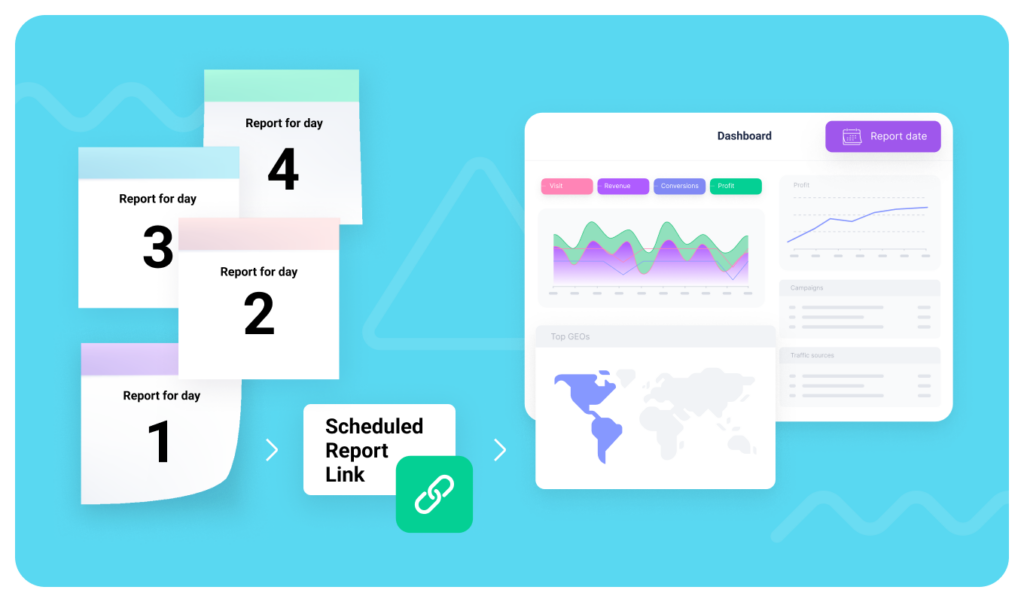
Having data ready in such an accessible way begs to be used in all the ways you can imagine. Mostly, you can use the Scheduled Report link as a data source to feed a data visualization tool of your choice, such as:
🪄 Google Looker Studio
🪄 Tableau
🪄 Microsoft Power BI
Then, you can design beautiful and meaningful dashboards and reports that you can share with:
👨💼 Coworkers
🧑💻 Clients
👩💼Executives
Here’s an example of what you can do with Scheduled Reports and Google Looker Studio:
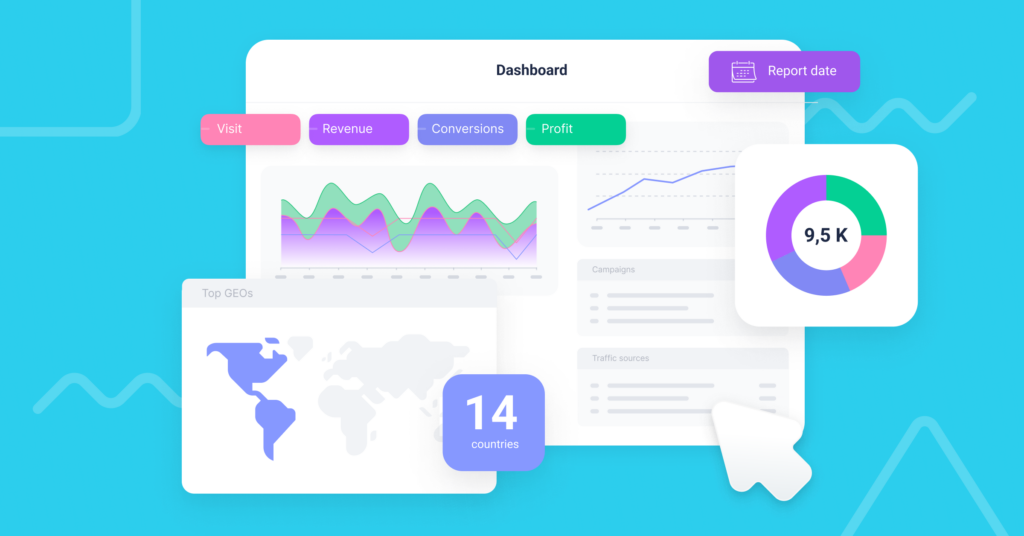
We dare you to do better!
How Do You Set Up a Scheduled Report in Voluum?
The setup process is as simplistic as it gets. It consists of 4 steps:
- Click the ‘Advanced‘ tab and select Scheduled Reports.
- Select the time range and time of day, and optionally, traffic source and campaign filters.
- Outline the data you want to have included in your reports.
- Name your report & provide email addresses where the report should be sent.
Once that’s done, just click ‘Request’, and Voluum will start processing data immediately. When it finishes, the recipients will get an email with the scheduled report link.
Check out our Scheduled Reports documentation for more details.
At this point, you may be asking: what’s next? Worry not, just go to the next paragraph.
How Can You Connect Scheduled Reports to Data Visualization Platforms?
What Managed Services Does Voluum Offer for Dashboard Setup?
The quick way to do this is to ask us for help. We offer a managed service where we guide you through the process of setting up a custom dashboard with Looker Studio. If you don’t have the skills or time to deal with a multitude of options and caveats, contact us to discuss your case.
How Do You Manually Integrate Voluum Scheduled Reports with BI Tools?
Depending on the tool you choose, there are different ways of setting them up, and each platform may have its own limitations and caveats. Please familiarize yourself with the tool’s documentation.
The main process can be divided into 3 steps:
Step 1: Create Scheduled Report(s)
Firstly, you need to create a scheduled report with the data scope of your choice. A single scheduled report may contain up to four grouping options (dimensions). If you want more dimensions in your dashboard, you can set more than one scheduled report and then blend data.
To do so, you need to have one common dimension across all reports to correctly match the data. We recommend using Campaign ID for that.
Also, consider the fact that some tools, for example, Google Looker Studio, limit the maximum size of the CSV file. For Looker Studio, the limit is 200MB.
Step 2: Set the data source
This may be the hardest step out of all. You obviously can simply upload the CSV file manually, but you would have to do so every day.
That’s not the way to do it.
Our team recommends using a Zapier-style service, Make.com, to automatically upload the contents of the CSV file to Google Cloud. Once you do so, you can easily pull data from the cloud to Looker Studio.
For Looker Studio, you can also use the Supermetrics connector to fetch data from the CSV file.
Microsoft Power BI on the other hand simply accepts the link to the CSV file. You can set automatic data refresh intervals, so your dashboards will always be up-to-date.
Once you set your scheduled report(s) as a data source, the fun part begins.
Step 3: Design a custom dashboard
Now comes the best part: you can start adding elements to your dashboard and define them. Elements usually come in various forms, such as:
- Tables
- Charts
- Maps with top GEOs
- Rankings
- Etc.
Set elements and drag them where you see them fit. Then set up sharing options so all interested parties may have access to it.
Show them what you’ve created!
Why Are Scheduled Reports Essential for Advanced Reporting in Voluum?
Scheduled Reports take the best Voluum feature – its reliable and robust database – and enable you to use it in other data analysis tools. What we’ve always wanted to give our users is flexibility and the ability to work as they please.
With this feature, it is now possible on a level that hasn’t been possible before.
Check out Voluum with Scheduled Reports now!
Frequently Asked Questions
Question: What are Voluum Scheduled Reports?
Voluum Scheduled Reports are automated exports of your campaign data in CSV format, sent regularly via email, making it easy to analyze metrics outside the Voluum platform.
Question: How can I connect Voluum Scheduled Reports to BI and visualization tools?
You can use connectors or automation services like Make.com to upload CSV files to the cloud and link them to platforms like Looker Studio, Tableau, or Power BI, enabling automatic data refresh and custom dashboard creation.
Question: What benefits do Scheduled Reports bring to Voluum users?
Scheduled Reports provide flexibility, allowing users to build advanced analytics dashboards, share insights easily with coworkers or clients, and leverage external data analysis tools for a competitive advantage.
Question: What is the process to set up a Scheduled Report in Voluum?
Go to the Advanced tab, select Scheduled Reports, customize the data scope and recipients, set the frequency, and submit your report. A recurring link to the latest data is then shared with the selected recipients.
Question: Can Voluum help me build a custom dashboard if I need assistance?
Yes, Voluum offers managed services to help set up custom dashboards with platforms like Looker Studio if you need expert guidance.


