DebugView in Google Analytics 4: Your Secret Weapon for Unleashing Analytics Superpowers!

In a digital marketing world, data rules the roost. But not just any data – accurate and reliable data.
It’s not difficult to set up a zillion of events to be tracked in Google Analytics 4. But without ensuring that they fire when correct elements are clicked and the right data is passed along, such data have little credibility.
Enter DebugView, the ultimate feature for testing and improving your analytics. In this article, we’ll dive into what DebugView is all about, how it can turbocharge your analytics.
Unveiling DebugView in GA4
Alright, folks, let’s talk about DebugView – the ace up your sleeve in GA4.
What is it?
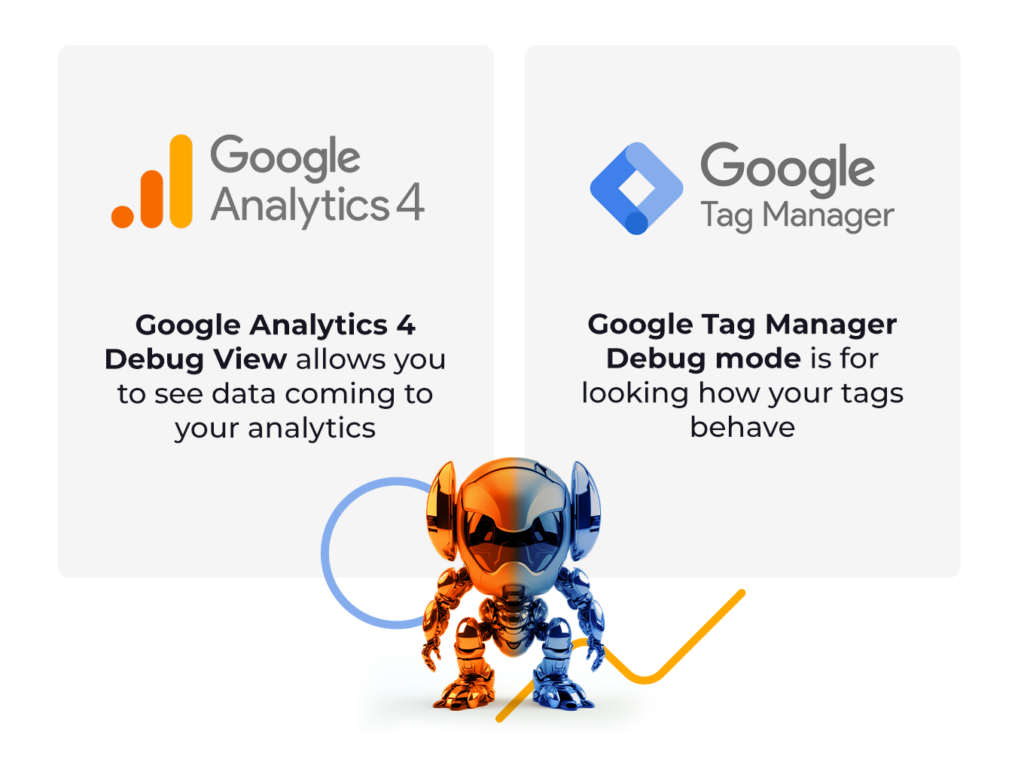
It’s a feature that lets you monitor all events and parameters on your page to ensure your tracking setup is firing on all cylinders. You can troubleshoot your setup without breaking anything or skewing your statistics.
Note that Google Tag Manager also has its own DebugView. They operate under similar principle but allow to look into different things:
Why DebugView May Rock Your Analytics World
The benefits of DebugView in Google Analytics 4 quickly become apparent once you start using the feature. Whether it’s button clicks, form submissions, or video plays, DebugView lets you make sure that tracking of these events works flawlessly.
The benefits of using DebugView include:
- Real-time Data Validation: Instantly verify if your tracking codes and events are set up correctly and if they fire when they are supposed to and if custom dimensions pass the right data. DebugView ensures your data is accurate and prevents those data discrepancies from derailing your campaigns.
- Troubleshooting Made Easy: Setting up custom events in Google Analytics 4 is tricky. DebugView allows you to be sure that everything behaves the way it is supposed to
- Testing: Want to try out new tracking setups without messing up your live data? DebugView has your back! It lets you test and evaluate changes without breaking a sweat. Check new & more advanced setups
How to Access DebugView in Google Analytics 4
DebugView can be enabled for your own device only or for all devices. The first option is recommended for troubleshooting your GA4 installation.
- To enable DebugView on your personal device, you can either download Google Analytics Debugger Chrome extension or through Google Tag Assistant (if you’ve set up Google Analytics 4 with Google Tag Manager).
- To enable DebugView for all devices, you can either add the ‘debug_mode’:true command to all or selected events in your Google tag or set it up in a Google Analytics: GA4 configuration tag.
Once you set the DebugView, you can access it via the Admin panel.
How to Use DebugView in Google Analytics 4
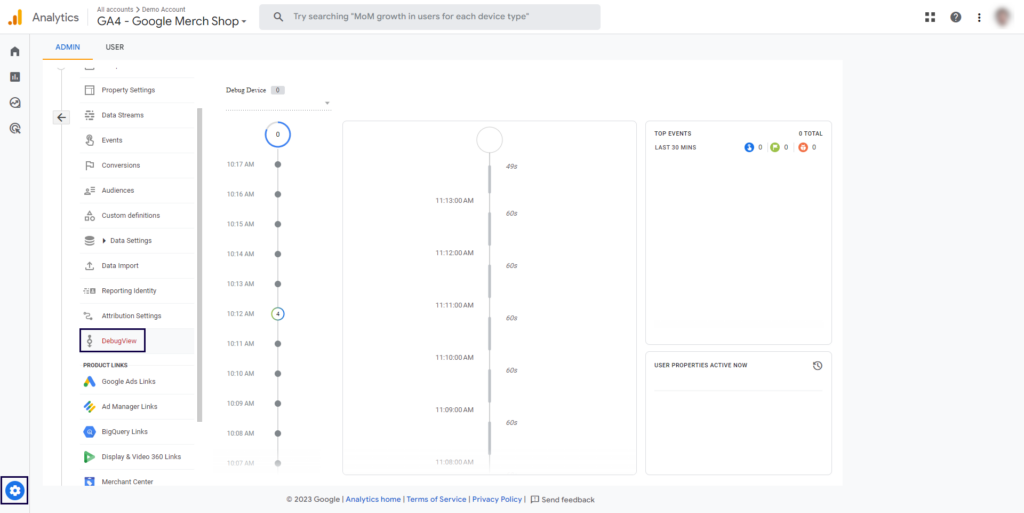
The DebugView presents the following data types:
- Timeline (minutes)
- Timeline (seconds)
- Top Events
- User Properties
- Device Selector
Once you start receiving data, both timelines will fill with events. You can click on the white background to pause the timeline.
When you spot an event you want to troubleshoot – click it and you will see the details. You will see a list of parameters tied to each event and values that were passed.
The events are color-coded:
- General events are blue
- Conversions are green
- Errors are orange
DebugView Can Make Analytics Great Again!
Whether something’s broken or you are not getting the types of data you expected to see, DebugView has your back. Contrary to what the name may suggest, it doesn’t require any developer knowledge to master. It is intuitive as it can be: just click around & find out!


