They are the key to know how your campaigns perform. But marketing reports that are overloaded with data can effectively blur out what’s really important. We’ve gathered the 7 most useful views to let you see what’s meaningful and improve without losing too much time. Interested? Read on.
It was as early as in the middle of twentieth century when Peter Drucker, a father of modern management, said:
If you can’t measure it, you can’t improve it.
This quote holds true in today’s world and will be for many, many future decades – or centuries – as well.
But this doesn’t mean that if you measure everything, you will be able to improve everything. The quote should be followed with another statement – if you measure just the right amount of data, you can improve faster. Why?
Don’t get overloaded with data
We live in a time of information. We are surrounded by it. We live and breath information. It is said that what we receive every day is equal to what average nineteenth-century person got through an entire lifetime. And it was just 100 to 200 years ago!
Since we’ve learned how to navigate in such world, our attention spans have decreased – to process only what’s important. However, if we’re supposed to skim through all that data and texts, we can skip something meaningful along the way.
And, if we were to talk about performance marketing, that could be an optimization opportunity, just waiting to tackle. It’s easy to get enormous amount of details about your data, you just get Voluum, set it up and look through the data. The measures are shown in a way that allows you extract actionable insights. But you can get more.
Organizing your data in a way that allows you to see what’s important at the time you’re looking at it, is crucial for you to extract insights, make decisions and take actions that will bring you closer to your goal – which is ultimately higher profits.
We have gathered 7 reports for you that can support you in achieving your goals. Ready?
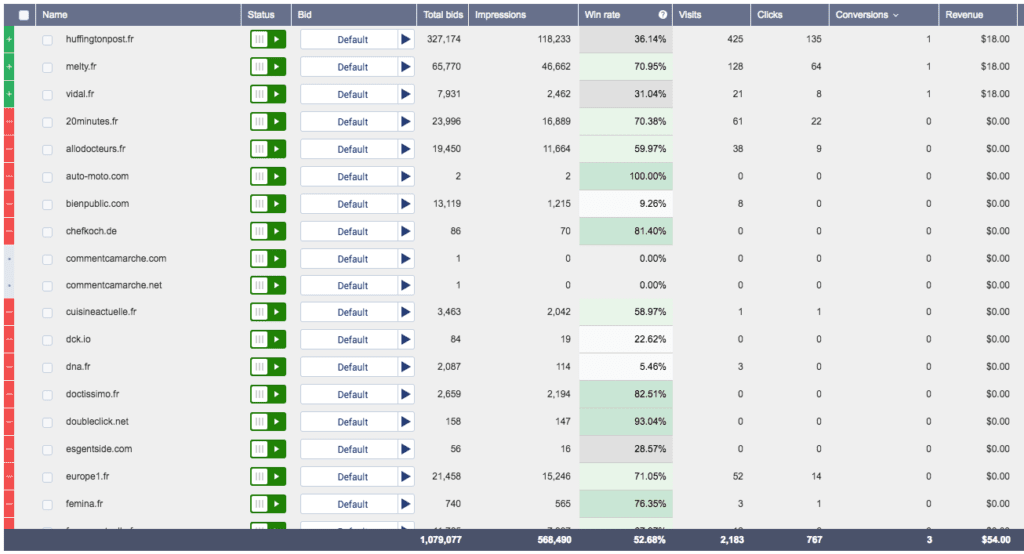
1 Site Report
Although the tracker shows you which websites your ads are appearing on, with a site report, you can identify where your ads perform the best. Here, you can quickly see where your money is wasted and stop the ads being shown there.
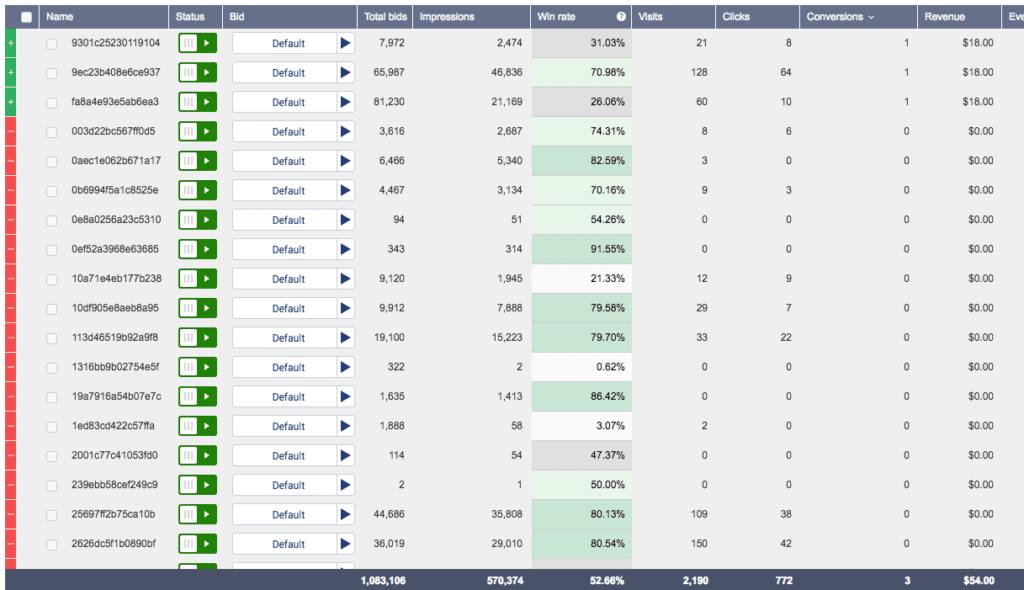
2 Widget Report
If you are into native advertising, the site reports might sometimes be misleading. For example, you could see slightly bad performance on one of them and stop the traffic. But what if there’s one widget there which gives you positive ROI but all the other ones are burning your budget?
Site widget report allows you to go one step deeper to not getting rid of something that’s doing fine. After stopping the bad apples, you can focus on scaling up using profitable widgets.
3 App Report
There’s a similar story with app reports. With such a view, you can seek out the apps that make your advertising profitable and have the potential to scale up your investments in them.
4 Operating System/ OS Version Report
Another useful report is showing you the Operating Systems your audience is running or even what version of the OS they use.
It is especially useful if you advertise software for one platform – or would like to advertise separately for, say, Windows and OS X. You’ll be able to see if your personalized creatives really land on the OSes you target – or if the personalization works at all for you.
The OS and especially the OS version might suggest who’s your target audience. Newer operating systems are used by people who probably like hot new technology and are more keen on buying another tech gadget. They are also more likely to spend more at your shop. But you won’t know for sure until you look into this report.
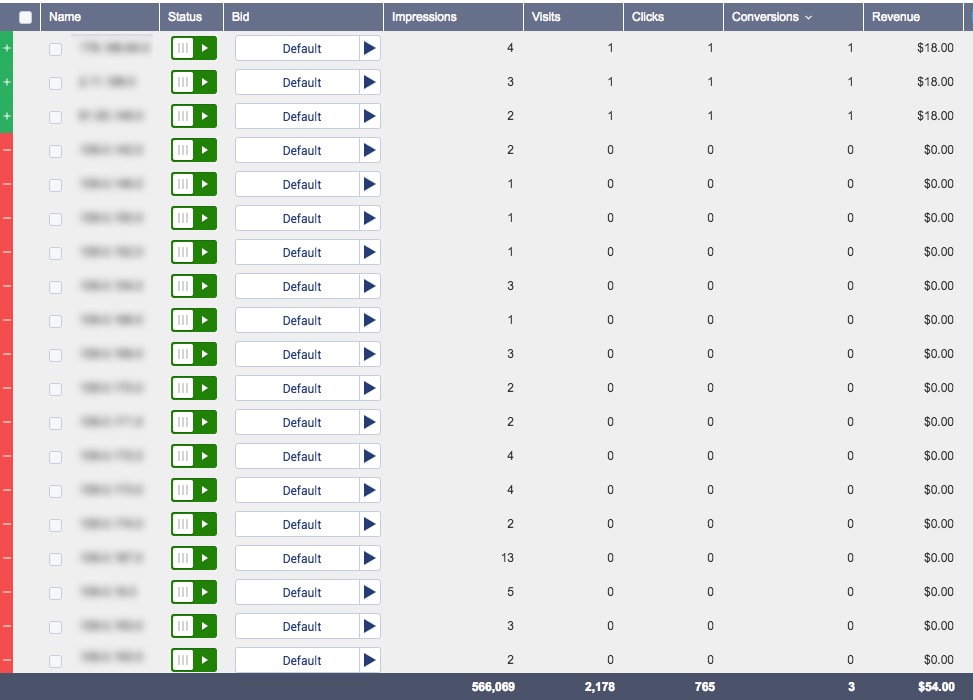
5 IP address report
This report is very important – and we’re not even talking about checking the location of your clicks. As we know from Kamila’s article, more than a half of all web traffic is created by bots. Bots bring you meaningless data and make you pay for non-human clicks. You can be sure that no bot will buy your product, or the product you currently advertise.
So if you look at the IP address reports, you can identify which IPs are more likely to bring bot traffic and burn your budget. You can identify them by low iCTRs, even lower CTRs, and almost zero conversions on high traffic volumes.
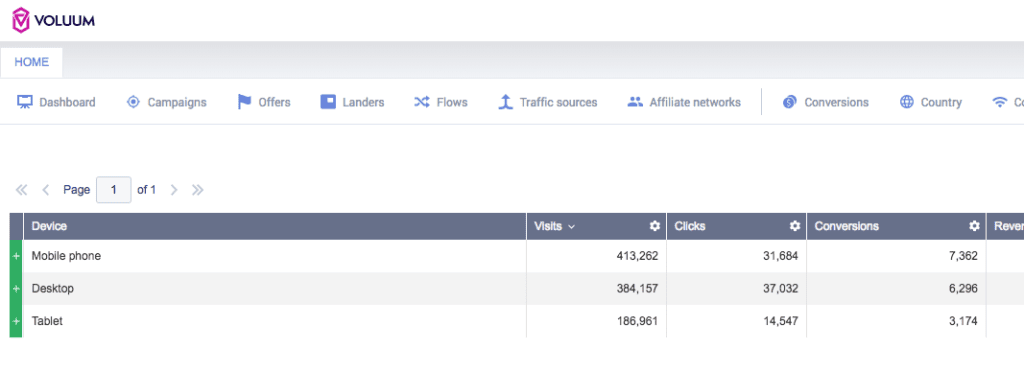
6 Device Type report
The best practice for device targeting is to create different campaign for every device. If your rebel soul won’t let you get along with the best practices, you should look quite often into the Device Type Report.
With this view, you can check if the campaign is performing well on every device, optimize if so, and dig deeper if some devices are underperforming.
7 Keyword report
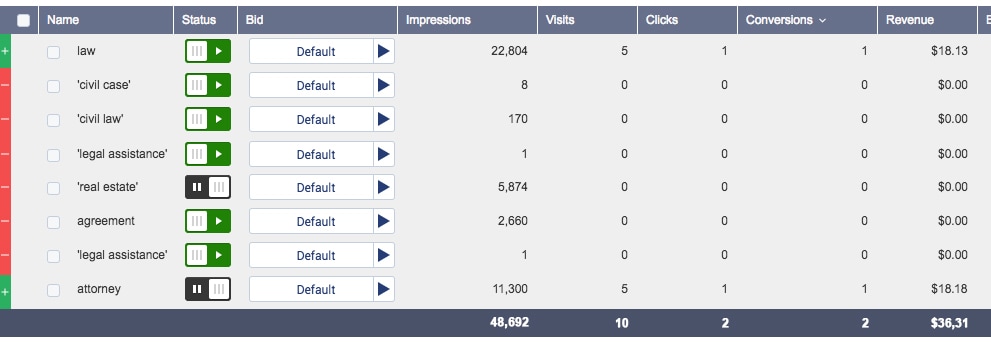
Although the keyword report might seem relevant only to paid search traffic, it is useful in any other form of contextual targeting. With the overview of keywords you use, you’re more likely to identify which keywords work for you and which don’t.
This way, you’ll be also able to better assess the performance of websites on which your ads are shown. As there are various types of contextual targeting, sometimes the keyword doesn’t mean the right context. For example, users reading about Samsung smartphones might not be interested in iPhones just because of the fact that they’re both types of smartphones. This report allows you to find intent-based keywords which will convert more.
These are the reports – what about the metrics?
Okay, so you know how to gather data but which metrics can give you a clue about your performance?
iCTR is the click through rate of impressions. With low iCTR you’ll know that the creatives and headlines could be more compelling to the audience. This means that it’s not attractive enough to users to click on the ad.
Then comes the CTR. It’s the click through rate – in most cases it will reveal if your landing page is persuasive and builds confidence of the users to take the desired action. If not, you’ll observe low CTRs.
EPV allows you to set the conversion rate against your number of visits. This way, you can see how much you earn on average per visit. It’s one of the key metrics if you promote CPA offers on traffic sources with CPM cost model.
It is highly important to monitor your ROI based on CPA, the cost per acquisition, set against your profits. For actionable results, it’s good to look at a two-month time scope. It depends on the type of your business – of course – and should be connected to the customer’s buying cycle length. With two-month time scope, you’ll probably get that various lengths of customers moving through the funnel into the report.
That’s not all…
Well, that’s it for this article but mind you – there are multiple strategies that use different reports to assess campaigns from different angles. It all comes down to the business case.
So, let’s light the comments up! What other reports do you find useful in your advertising?
Key takeaways:
- It’s easy to get lost in too much data – look at one report at a time
- Site report helps you identify the best performing websites
- Site widget report shows you how different widgets perform on websites
- App report helps you discover the best performing app placements
- OS/OS version can help you determine the buying behaviour of users
- IP report can help you filter out bot traffic
- Device Type report allows you to check performance per platform


