
Incrementality Testing: Methods, Formulas and a Simple Test Design for Paid Traffic

Pause your best campaign for a week. How many conversions would you lose?
If you answered “all the ones it reports,” you’re trusting your attribution. If you answered “no idea,” you’ve just met the question that incrementality testing exists to answer, and the answer is often less flattering than the dashboard.
Short answer: incrementality testing measures how many conversions your ads actually caused. You compare a group that sees your ads with a comparable group that doesn’t, and the difference is your incremental lift, the one number attribution can’t give you.
This guide is for media buyers, affiliates and agencies who spend real money on paid traffic and want to know which campaigns earn their budget. It covers the formulas, the four main ways to measure incrementality, how to match a method to your traffic source, and a simple test you can run with tools you already have. It also shows where Voluum fits: it won’t create your holdout, but it supplies the numbers you compare.
What Incrementality Means, and What Attribution Can’t Tell You
Attribution answers a bookkeeping question: which touchpoint gets credit for a conversion that happened. Our guides to attribution models and attribution windows cover how that credit is split and how long it’s held. Incrementality asks something harder. Would the conversion have happened without that touchpoint?
The difference matters most where your ads reach people who were already on their way. Think of retargeting as a lifeguard who takes credit for every swimmer who makes it back to shore, including the ones who were never in trouble. Brand keywords, coupon and loyalty traffic, and campaigns aimed at your own lander visitors behave this way to some degree: they collect conversions that were likely to happen anyway. Cold traffic tends to do the opposite and creates demand that wasn’t there, which is why the same ROAS on two campaigns can mean very different things.
Google’s documentation describes incrementality experiments as the way to measure the causal impact of ads, and that’s the right way to think about them. Attribution tells you where a conversion was recorded. An experiment tells you whether your spend moved it.
The Math: Lift, Incremental Conversions and iROAS
Every incrementality test boils down to the same comparison. The test group sees your ads. The control group is comparable but doesn’t. Whatever happens in the control group is your baseline, the conversions you’d get anyway, and whatever the test group adds on top is the incremental part. Four formulas turn that into decisions:
- Incremental conversions = test conversions minus control conversions (scale the control number first if the groups differ in size)
- Lift = incremental conversions ÷ control conversions
- Incremental ROAS (iROAS) = incremental revenue ÷ ad spend
- Cost per incremental conversion = ad spend ÷ incremental conversions
Here’s how that plays out. Say you run a retargeting campaign for a CPA offer that pays $30 per conversion. You spend $9,000 over two weeks, and your tracker credits the campaign with 540 conversions. That’s $16.67 per conversion and a 1.8x ROAS, which looks like an easy scale-up.
Then you run a test. In the GEOs where retargeting stayed on, you collect 610 conversions in total, from all sources. In matched GEOs where you switched it off, you still collect 420. The ads added 190 conversions, a lift of 45%, and each one cost you $47.37, more than the $30 payout. The campaign that looked healthy is losing money on the sales it actually causes.
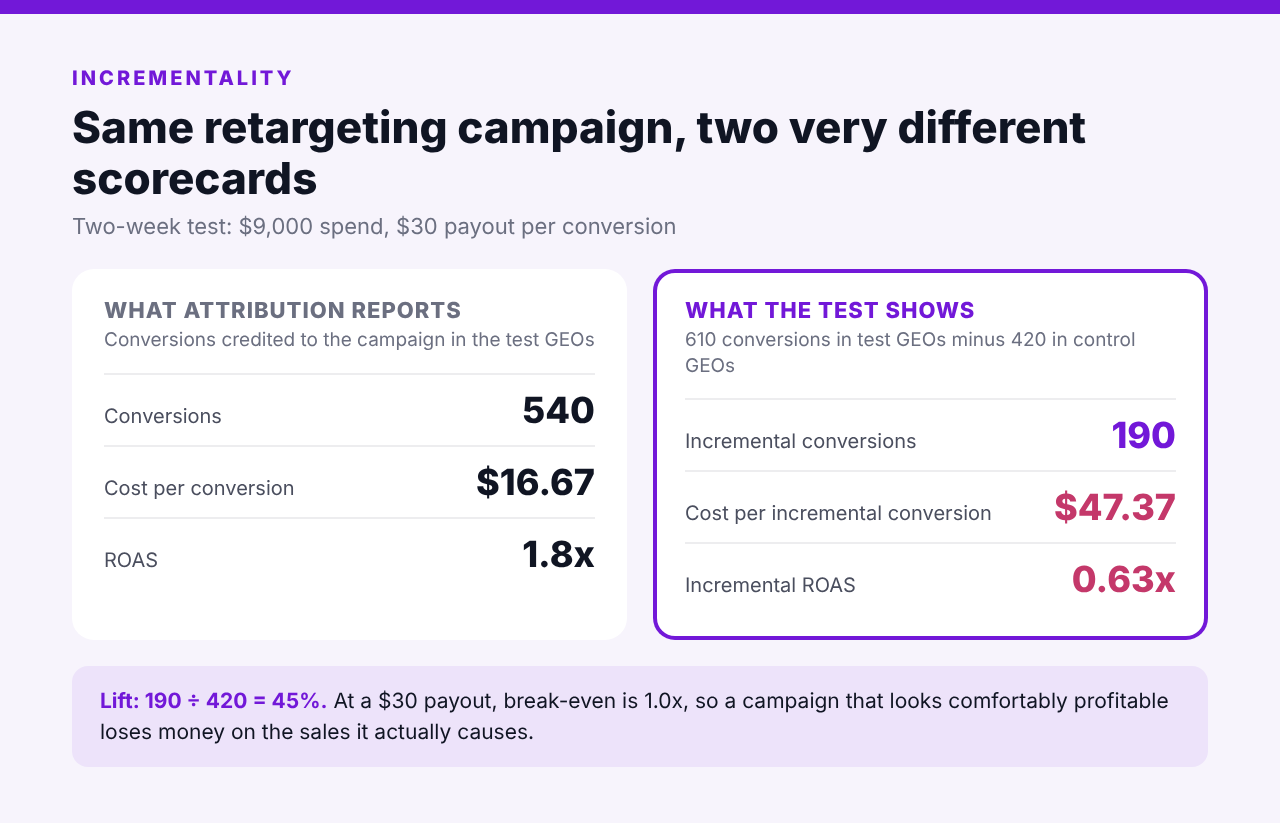
None of this makes the 540 wrong. They were real conversions from people who saw your ads. The test shows that about two thirds of them would have happened without the ad. Compare the iROAS with your break-even point, as described in our break-even ROAS guide, and you know whether to scale, cut or rework the campaign. These are also the metrics the platforms themselves report: Google’s geo-based Conversion Lift, for example, is built to show the total incremental return on ad spend of your campaigns.
Four Ways to Run Incrementality Testing
There’s no single right method. Each one trades precision for effort, and the best choice depends on where your traffic comes from.
Platform Lift Studies
Meta’s lift studies randomly assign accounts to a test group that sees your ads and a control group that doesn’t, then calculate the difference. Google offers Conversion Lift based on users or on geography, but it isn’t available on every account, so you may need to ask your Google rep to switch it on. Because the split is randomized, this is the cleanest method when you have access. Its limits are that it only measures that one platform, and that holdouts have a cost: bigger control groups give you more data faster but mean more users who never see your ads.
Geo Experiments
A geo experiment applies the treatment to whole regions instead of individual users. Ads run in the test regions and stay off in the control regions, and you compare total results. It works with any source where you control location targeting, and it doesn’t depend on user-level tracking.
Two open-source tools do the statistics for you. Meta’s GeoLift builds a synthetic control, a weighted blend of control regions that mirrors how the test region behaved before the test, and it includes power calculators for choosing markets and test length. Google’s Meridian GeoX is publisher-agnostic and supports designs such as holdback and go-dark. One caveat from Meta’s own documentation: people-based tests have more statistical power than geo-based ones, so geo tests make the most sense when a platform lift study isn’t an option.
On/Off Tests Over Time
The simplest version pauses a campaign for a stretch and compares results before and during the pause. It’s fast and free, and it’s the weakest option, because anything else that changes in that window gets blamed on the ads or credited to them: a promotion, a holiday, a competitor, another channel. Use it as a sanity check, not as proof.
Marketing Mix Modeling
Marketing mix modeling (MMM) estimates each channel’s contribution from aggregated spend and results over a long period. Google’s Meridian and Meta’s Robyn are the best-known open-source options. MMM works best when it’s calibrated with experiment results, which is why it complements incrementality testing rather than replacing it. It also needs a long history and some statistical skill, so most media buyers start with experiments.
| Method | What you need | Best for | Main weakness |
|---|---|---|---|
| Platform lift study | An eligible campaign on a platform that offers one | Meta and Google campaigns | Measures only that platform; availability varies |
| Geo experiment | GEO-level data, GEO targeting and several comparable regions | Any source where you control location | Needs enough regions and volume; spillover between regions |
| On/off test | One campaign you can pause | A quick sanity check | Seasonality and other changes muddy the result |
| Marketing mix model | A long history of spend and results across channels | Budget allocation across many channels | Needs lots of data and expertise |
Which Method Fits Which Traffic
Meta and Google campaigns. Start with the platform’s lift study if you’re eligible. It’s randomized, and you skip the work of matching regions. If you use Google’s geography-based version, note that campaigns must target a single country, and that it typically needs a higher budget than the user-based alternative.
Everything else. Push, pop, native, many S2S networks and most affiliate sources don’t offer lift studies. They do let you choose where your ads run, so geo holdouts fit well, with time-based pauses as a fallback. These sources also tend to hide plenty from your tracker, as our guide to tracking in walled gardens explains, which is one more reason to measure results at the GEO level in your own reports.
Funnels with long delays. Many affiliate and iGaming offers convert days or weeks after the click. If your test ends before those conversions arrive, the ads will look weaker than they are. Google even models delayed incremental conversions after a study ends for some campaign types, which shows how much lag matters. Our posts on attribution windows and on moving from FTDs to lifetime value explain how to handle it.
A Simple Test Design for Paid Traffic
You don’t need a data science team for a first test. You need one campaign, a few comparable GEOs and the patience to leave everything alone for a while.
- Pick one campaign and one outcome. Choose the conversion you’re actually paid for, such as an approved sale or an FTD, not clicks or leads you can’t monetize.
- Match your GEOs. Pull daily conversions per GEO for the weeks before the test and group regions whose results moved together. Split them into test and control groups of similar volume. In the example above, both groups had produced about 600 conversions in the two weeks before the test, which is why the control group’s 420 reads as a baseline. If your groups differ before the test, compare each group’s change from its own starting level instead.
- Switch the ads off in the control GEOs. Leave everything else alone in both groups: creatives, landers, offers, bids, budgets and other channels. Any extra change is a new variable.
- Decide the duration before you start. Cover at least one full cycle from click to the conversion you get paid for, and don’t stop early because the first days look good or bad. Google itself recommends waiting until the end of a study for the most accurate results.
- Size the test properly. A test with too few conversions can show no lift even when the ads work. GeoLift’s documentation warns that skipping a power analysis makes that outcome likely, so check that your groups produce enough conversions to detect the effect you care about.
- Measure the same way in both groups. Count total conversions per GEO from all sources, not only the ones credited to the campaign. Then calculate lift, incremental conversions and iROAS.
- Act, then retest. Scale what clears your break-even point, cut what doesn’t, and repeat the test when budgets, creatives or seasons change. Google notes that lift results fall within a confidence interval, so one test is a data point, not a verdict.
In the retargeting example, the buyer switched the campaign off in three of six matched GEOs for two weeks. The next section shows what that looks like in the report.
Running the Test With Voluum Data
Voluum doesn’t create the holdout. Your ad platform’s GEO targeting does that. What Voluum gives you is the measurement side: one consistent set of clicks, conversions, revenue and cost across every traffic source, which you can split by location and date. That matters because your platforms and your tracker count conversions differently, and a test only works if both groups are measured the same way.
A few features do most of the work:
- The Country report. Voluum’s Country report breaks traffic down by country, state or city, so you can compare test and control regions over the exact date range of your test.
- Cost per GEO. Costs come from integrations, tokens or manual updates. If you update them manually, use the same time zone and time range as your traffic source, so spend and conversions line up.
- An organic baseline. A separate campaign using the default Organic traffic source and a direct tracking script on your landers records visits and conversions that arrive without a paid click, so the baseline sits in the same reports as your paid campaigns.
- Clean data. Use test mode when you check your funnel, so your own test clicks don’t pollute the numbers you’re about to analyze.
- Export. Export to CSV, or set up scheduled reports, to run the final calculations in a spreadsheet or feed the data to a tool like GeoLift.
One setting to watch: by default, Voluum reports a conversion on the date of the visit, not the date the postback arrived. A conversion that lands after your test ends still counts toward the day of the click, so re-run the report once your conversion lag has passed.
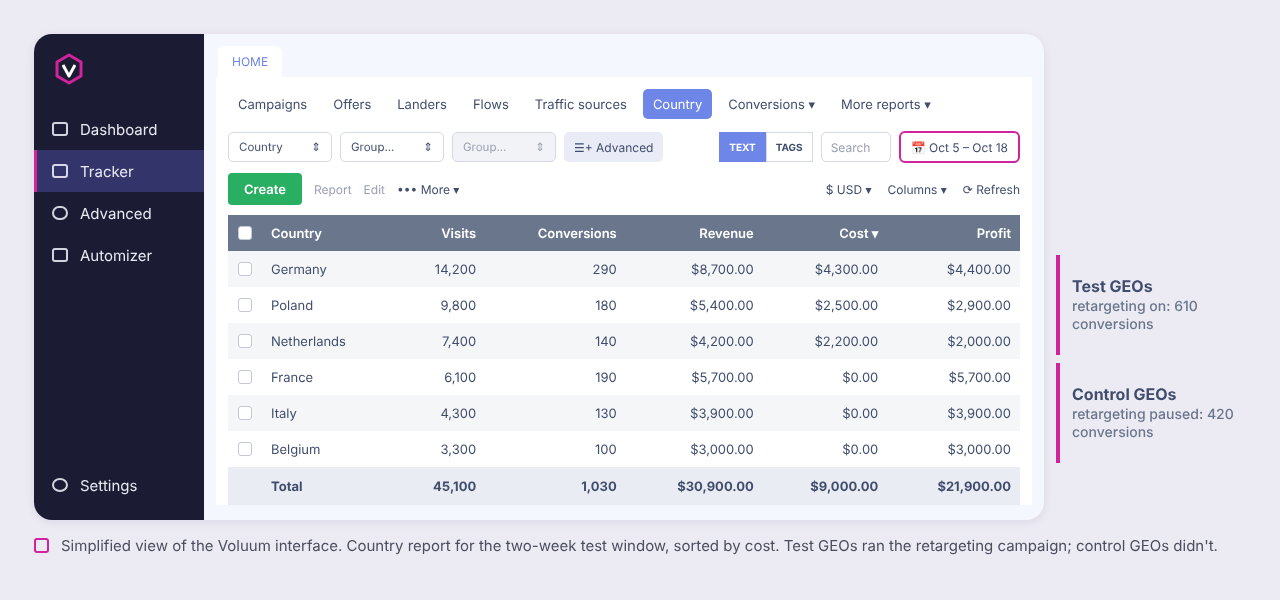
Sorted by cost, the report splits itself in two. The three GEOs with spend are the test group, and their conversions add up to 610. The three with $0 cost are the control group, with 420. Those two totals are all the formulas above need, plus your spend and payout. If your offer pays on revenue share or varies by player, use revenue instead of conversion counts. Voluum’s Revenue column gives you that, and our KPI guide shows how to put it in a saved report.
Mistakes That Ruin Incrementality Tests
- Leaky regions. If people or ads cross between test and control GEOs, the control group isn’t really unexposed, and the measured lift shrinks. Google’s documentation notes that this kind of contamination reduces the reported incrementality of a campaign. Pick GEOs that are far apart where you can.
- Changing things mid-test. A new creative, a bid change or a budget shift in one group turns a clean comparison into guesswork.
- Testing across a big promotion. Sales events lift every region at once and can bury a small effect. If you’re testing around Black Friday, plan the window carefully.
- Judging by platform-reported numbers. The outcome has to come from a source that sees both groups equally, like your tracker or your backend, not from the platform whose ads you’re testing.
- Forgetting that a holdout costs money. Control GEOs lose the conversions the ads would have added. That’s the price of knowing, and it’s usually smaller than the budget you’d keep spending on a campaign that doesn’t pay off.
- Testing once. Audiences, creatives and competition change. Retest the campaigns that matter most whenever the setup does.
Compare Test and Control on the Same Numbers
Voluum puts clicks, conversions, revenue and cost from every traffic source into one report you can split by country and date, so your test and control GEOs are judged on identical data. See how Voluum tracks and reports your campaigns.
Frequently Asked Questions
What is incrementality in marketing?
Incrementality is the share of your results that your advertising actually caused. It’s measured by comparing people or regions that see your ads with comparable ones that don’t. If a campaign credits itself with 500 conversions but only 200 would disappear without it, its incremental contribution is 200.
What is the difference between incrementality and attribution?
Attribution assigns credit for a conversion to the touchpoints that came before it, using rules such as last click or time decay. Incrementality testing asks whether the conversion would have happened without those touchpoints. Attribution describes what was recorded, while incrementality estimates what the ads changed.
How do you calculate incremental lift?
Subtract the control group’s conversions from the test group’s to get incremental conversions, then divide by the control group’s conversions. If the test GEOs produce 610 conversions and the control GEOs produce 420, the lift is 190 ÷ 420, or about 45%. Scale the control number first if the groups differ in size.
How long should an incrementality test run?
There’s no fixed number. Run it long enough to cover a full cycle from click to the conversion you get paid for, and long enough to collect enough conversions to detect the effect you care about. A power analysis, such as the calculators in GeoLift, helps you set the length. Don’t stop early because the first days look good.
Can you run an incrementality test without platform tools?
Yes. If your traffic source lets you choose where ads run, you can switch ads off in matched control GEOs and compare total conversions per GEO in your tracker. It’s less precise than a randomized platform test, so check that your groups were similar before the test and that nothing else changed. Open-source tools like GeoLift can help with the analysis.



 Facebook
 Telegram


